Query Analysis
Overview
The Query Analysis chart provides detailed insights into your Snowflake query patterns, performance metrics, and execution details.
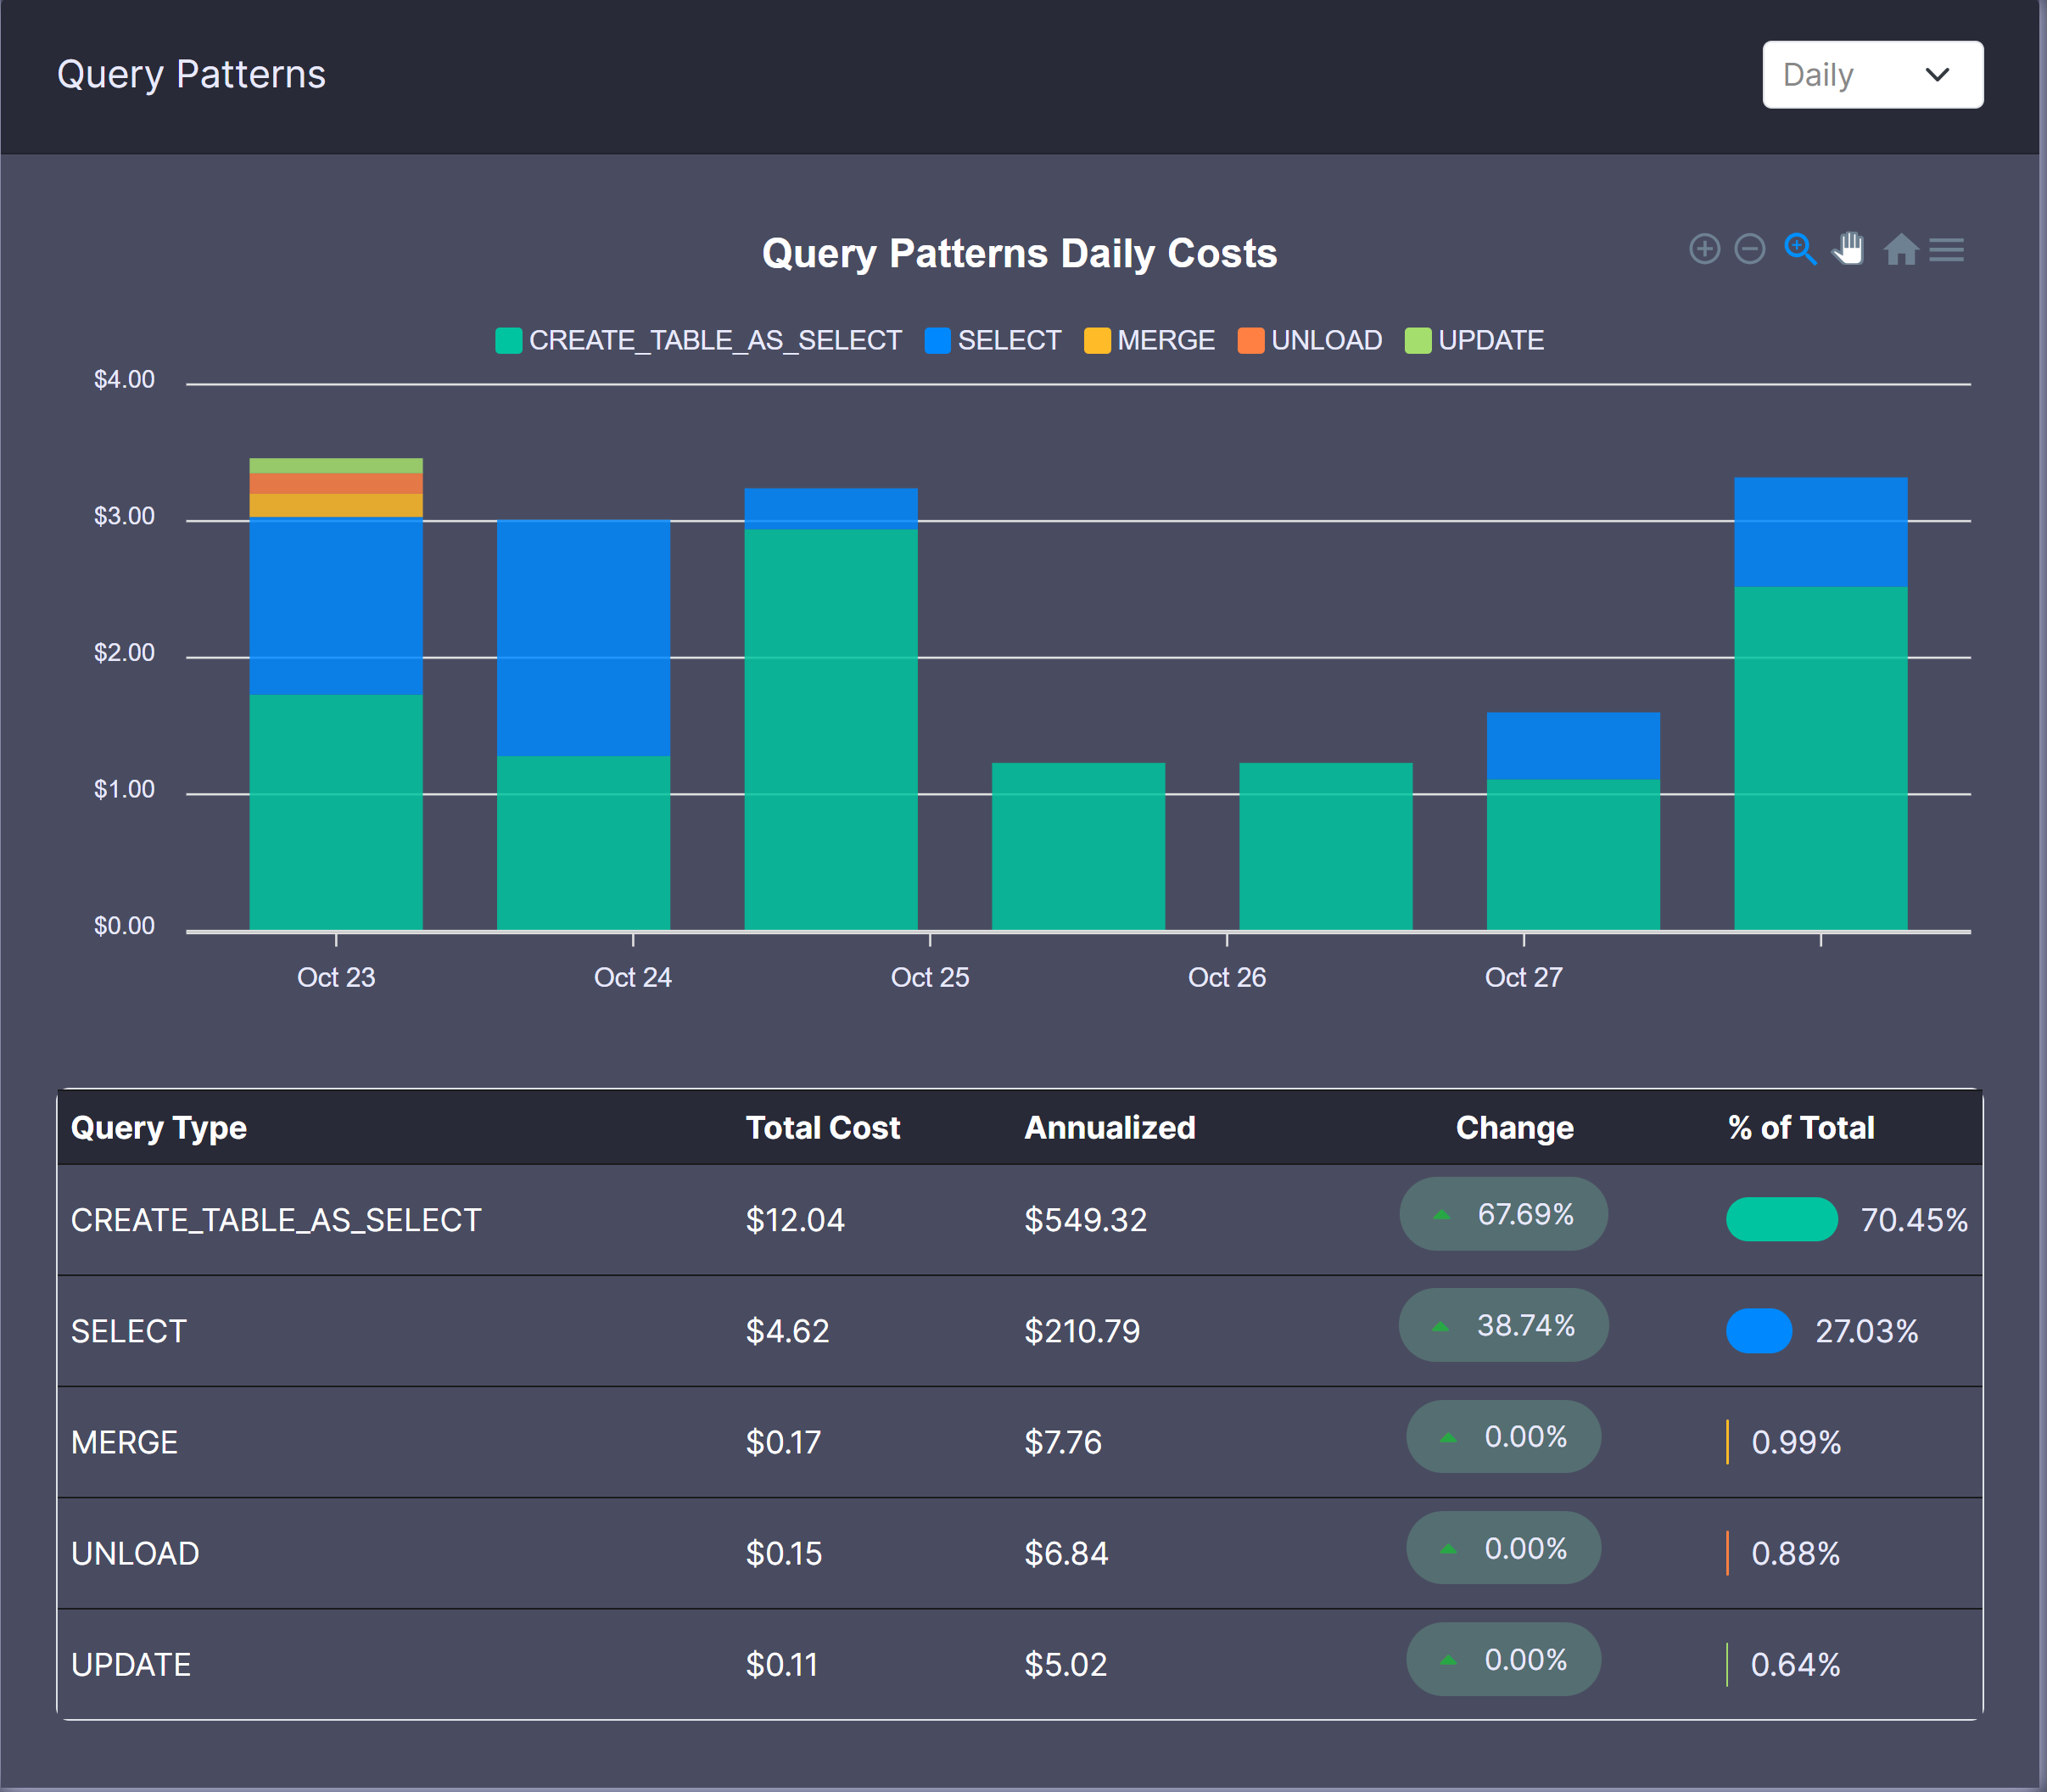
Summary Metrics
| Query Type | Total Cost | Annualized Cost | % of Total |
|---|---|---|---|
| SELECT | $5,000 | $60,000 | 70% |
| INSERT | $2,000 | $24,000 | 30% |
Detailed Query Analysis
Query List
Understanding the Query Details
The detailed query table shows:
- Full query text
- Average compute time
- Individual query cost
- Last execution timestamp
- Additional performance metrics
Click on any query to view its complete details in a modal window.
Query Details Modal
When clicking a query, you'll see:
- Query text
- Execution metrics
- Cost analysis
- Performance statistics
Query Analysis
Use the detailed view to:
- Identify expensive queries
- Track query patterns
- Optimize performance